How To Never Lose Money In The Stock Market Again - Guaranteed.
A master lesson
($1,497 Value)
"The Stock Market Is a Divine System—This Lesson Will Show You How to Align With It."
Welcome to a master lesson unlike anything you’ve encountered before. This isn’t another course packed with recycled strategies and technical jargon that deliver mixed results. This is an invitation to step outside the illusion—and into a higher level of understanding.
You’re about to discover what most never will:
That the stock market is not random, not chaotic, and not ruled by fear and greed.
It is a living, intelligent system—a reflection of Divine Order expressed through time, price, and geometry.

When you align with that order, something remarkable happens:
Market risk disappears.
You’ll know which investments to enter.
You’ll know when to exit with profit.
And you’ll know exactly when to wait.
I know what it’s like to be misled by so-called stock market experts and financial gurus.
I’ve watched them make hundreds of thousands of dollars charging the eager for their overpriced courses. I’ve watched social media influencers jump into lucrative lane of stock market education dodge accountability when their setups failed—and dismiss it like it was nothing them while those who followed the setup were left holding the bag.
If you’ve been there too, it’s not your fault—and you’re not alone.
That’s why I created this master lesson.
This is the lesson I wish someone had handed me when I was burned out, disillusioned, and ready to walk away from the markets. It’s more than a strategy. It’s a spiritual and practical alignment—a total reset for how you view risk, profit, and power.
Together, we’ll walk through a 3-step framework that uses stock options as a vehicle—not for gambling, but for precision wealth building. While 90% of options traders fail, you’ll learn how to operate on an entirely different frequency—where clarity replaces chaos, and profits flow from alignment, not chance.

If you're ready to stop gambling in the market—and start listening to its sacred rhythm—then you're exactly where you need to be.
Here’s what you’ll unlock in this controversial lesson:
This is not just about teaching you how to engage the stock market profitably; it’s about redefining your relationship with the stock market. Think of this as a tailored investing experience—a journey reserved for those who value craftsmanship and demand profitable results with elegance and precision.
For over three decades, this cutting-edge thinking and strategy have been honed like the work of a master artisan, blending timeless principles with modern ingenuity to create consistent, risk-free profits. Each element of this lesson has been designed with the care and detail of a bespoke creation, ensuring that what you learn here cannot be found anywhere else.
This journey is not for everyone—it’s for those who understand that consistent and profitable performance is your natural birthright. It’s for those who see the stock market not as a gamble but as an opportunity to thrive with purpose, clarity, and confidence.

If you’re ready to leave behind the chaos of inconsistent wins and reactionary strategies and step into a world of predictable, consistent success, your journey begins here. This is your chance to take control of your financial destiny, to elevate your investing to a place of certainty and privilege.
Let's begin...
Can Investing In Stock Options Deliver Profits With 100% Certainty?
Are you, like many before you, tired of losing money or missing out on the massive profit potential in the stock market? Are you in search of a hidden treasure map—a strategy so potent that it guarantees success in every investment in the stock market you take, even when most investors hit and mostly miss?
I can assure you, that such a map exists, and I'm excited to unveil the blueprint of this foolproof 3-step strategy. But before we embark on this voyage of enlightenment, I'll share why I'm compelled to share this well-guarded knowledge.

You see, using stock options as a profit-generating vehicle isn't just a casual interest for me; it's a lifelong passion that has held me captive for over three decades. Some might say my devotion borders on obsession, but in truth, it crossed that threshold long ago.
In the world of finance, few subjects rival the intrigue, empowerment, and profit potential of stock options. Yet, it's also a realm shrouded in mystery, a deliberate enigma designed to bewilder even the most intrepid stock market investor.
In these economic times, the promise of achieving stellar, risk-free results using stock options has never been more alluring. Never before has the siren call of profit been so compelling.
This options strategy doesn't demand an intimidating stack of option trading textbooks, the latest and greatest option trading app, or endless hours deciphering option trading beginner guides. You won't find yourself lost in the various option trading tutorials on YouTube or buried under the weight of complex options trading jargon.
No, there's no need to shell out a king's ransom for investment courses, join elusive trading circles, or rely on the crutches of sophisticated trading systems or bots.
You won't need to invoke the power of artificial intelligence to select the perfect options or resort to dubious insider information. The heart of the matter lies in one thing: piercing through the fog of complexity. And, my friend, that's the true challenge.
In truth, if your stock market investing journey has left you feeling more like a ship adrift than a seasoned captain, it's not your fault.
The overwhelming deluge of information, coupled with a cacophony of experts and gurus peddling divergent strategies, has left 85% of investors and traders, including those who are new to options, cast adrift in a sea of confusion.
If stock market investing has left you more financially uncertain than empowered, take a deep
breath and relax. We’re about to take aim at this confusion, blow away the smoke and
make things as simple as possible.
We’ll nail it down to a simple strategy. And with it, we can make the stock market our personal bank ATM.
But first, we must clear away some smoke...
The #1 Obstacle To Having Breakthrough Success In The Stock Market
We've all heard this age-old adage, haven't we?
"How you start is how you finish."
In the high-stakes world of financial markets, this saying holds more truth than ever. The key to unlocking transformative success in the stock market is a journey that begins and concludes with your mindset, or your psychological disposition.
You see, the stock market investment game isn't just about following or finding a strategy; it's a mindset game, where psychology accounts for a staggering 80%, leaving a mere 20% to the skillset.

Think of it as a cup filled with liquid—the cup is your thinking, and it sets the stage for how you perceive the markets. The liquid in the cup represents your strategy or technique, whether you've crafted it yourself or adopted someone else's. Regardless of the liquid's flavor, it will always take the shape of your thinking.
Here's the crux of it: if you commence with the right mindset, success is an inevitable outcome, regardless of economic conditions. However, if you embark on your journey with the wrong mindset, your results, no matter how well-devised the strategy, will be a hit-or-miss affair.
Making money from the stock market can appear perplexing and overwhelming, especially if you are new to this. But fear not, for clarity is within reach. Always remember that your starting point determines your destination.
Now, you might be wondering, "What is the mindset that guarantees a 100% chance of success in my stock market investing?" The answer is surprisingly straightforward.
You must forsake the Probability Mindset and renew your mind with the Certainty Mindset. The Probability Mindset is the "standard issue" mindset given to all investors as the cost of entry into the Wall Street Game. As you will learn, unbeknownst to you, you made a tacit agreement with Wall Street to be the bearer of risk for others in the stock market in exchange for a few wins here and there.
The strategy I'm about to unveil is firmly rooted in the Certainty Mindset-a powerful approach that can set you on the path to having things your way in the stock market.
Certainty Mindset: Master Market Reality
The ultimate timeline jump in thinking.
The Certainty Mindset arises from recognizing that profitability, at any time, in the stock market—or any financial market—is inevitable, regardless of seemingly opposing market conditions, when one aligns with the market's true fundamental nature. This success is not tied to the quality of your research, technical analysis, or fundamental analysis. Nor does it depend on shady insider information or market manipulation.
The Certainty Mindset asserts that (1) every financial market, at any time, has a true intent or objective reality that can exist outside of any investor's perceptive. (2) This objective reality can be known and observed because every financial market is derived from a single fundamental nature comprising a certain shape, structure, and color.
(3) Because this fundamental nature has a certain structure, the Certainty Mindset asserts that the nature of all financial markets is orderly (absence of randomness). (4) When one consistently aligns with this order, one achieves congruency with objective reality, making profitability not only consistent but market risk nonexistent.

all markets' true nature unveiled
To cultivate this alignment, you must bring to bear your emotional intelligence, intuition, logical insight, visual acumen, and abstract thinking upon the stock market. These contemplative processes tap into your deeper self—your anima or soul—allowing you to recognize your relation to profit from within so that you recognize profit externally in the markets.
Your subjective perceptions—fears, desires, projections—do not alter the market’s objective reality. Instead, they serve as the lens through which you observe it. If you cannot see the market’s true nature, even when it’s right in front of you, you will always subject yourself to market risk/distortion. Achieving this clarity is the pinnacle of trading and investing psychology.

With the Certainty Mindset, losses are not the result of random market forces or the cliché “you win some, you lose some.” They stem from internal distortions in your perception. Market congruency begins within but is exemplified outwardly through a logically sound, rigorously tested strategy. This strategy becomes an external reflection of your internal understanding, again, making market risk nonexistent.
This is the essence of Warren Buffett’s famous rule: “Don’t lose money.” While many investors strive to follow this principle, few succeed. The difference lies not in Buffett’s wealth but in his mental disposition—his unwavering certainty in the markets. While others operate with a Probability Mindset clouded by doubt, Buffett’s [mostly] Certainty Mindset sets him apart as a true master of the markets.

By aligning with the market’s objective reality and honing your inner clarity, you too can achieve consistent success. This inward-outward transformation unveils the market’s true nature, making profitability not just possible but inevitable, investment after investment, trade after trade.
Probability Mindset
The Probability Mindset stems from subjectivism, the belief that there are no objective truths or realities—only the unquestionable activity of one’s own mind. Investors with this mindset view the markets as devoid of objective reality or having an observable nature. Instead, one's perceptions are the “truth.”
This philosophical outlook creates a series of adverse consequences: (1) The true fundamental nature of all financial markets is hidden or veiled. (2) This self-imposed veil obscures any potential congruency between the investor and the market, thus creating an illusion that the market is separate from the investor. (3) This seeming separation creates phantoms that manifest as "random external market forces" to haunt the investor. (4) Unable to search or confide within for clarity, these investors must then "research" for external “evidence” to speculate and navigate these seemingly random external events to generate profit.
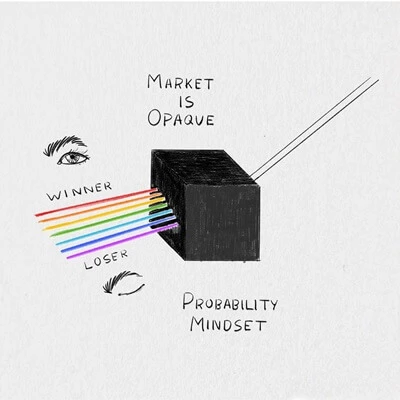
all markets' true nature veiled
This external, unnatural approach breeds inner uncertainty and is directly responsible for bringing market risk into investment decisions. In other words, randomness/uncertainty observed in the markets is the product of human ignorance of hidden variables within the nature of all financial markets.
While the Certainty Mindset recognizes market profitability as an organic flow from the inside out, the Probability Mindset seeks profitability from the outside in—through self-flagellation (masked as "trading discipline") and psychological projection. Investors in this mode project their desires, fears, and speculations onto the market and seek evidence that supports the projection through variables such as:
This approach locks investors into a spectrum of probable outcomes—fluctuating between wins and losses. Terms like "expectancy, “win rates,” “probability of wins,” “drawdowns,” “risk of ruin,” and trading discipline reflect this mindset, revealing a dependence on chance rather than certainty.
Another hallmark of the Probability Mindset is the belief in "following the smart money." Financial experts often encourage less-informed investors to mimic the strategies of the wealthy, assuming their success can be replicated. This advice posits wealth as something external, resting in the hands of others. Investors who follow this path relinquish their birthright, believing that someone else’s route to wealth is more significant than their own.
The rationale is that their wealth is an optical or perceived reflection of the decisions they made and, therefore, investing in what they invest in can bestow wealth on the uninformed investor.

In reality, this mindset reduces investors to mere market liquidity for others’ gain, suppressing their inner light while chasing external validation. By contrast, the Certainty Mindset empowers investors to see the market’s objective reality from within. It fosters a firm connection between their inner self and the true nature of all markets, bypassing the chaos of external speculation.
Investors must ultimately choose: remain outside the veil of uncertainty, relying on probabilities and external influences, or cultivate the Certainty Mindset to achieve clarity, control, and consistent success.
Structural Analysis Or
Sacred Geometry In The Stock Market
(Observing The Tesseract)

Structural analysis is the offspring of the Certainty Mindset, while technical and fundamental analysis is the offspring of the Probability Mindset.
Structural analysis is Sacred Geometry applied to the financial markets. Sacred geometry is an ancient teaching that the intricate patterns inherent in Nature/Universe are manifestations of divine intelligence, often referred to as "God," "Spirit," or Infinite Primal Source. These patterns (archetypes) serve as templates guiding the universe's unfoldment, containing the very essence of the Divine principles governing existence.
Delving into and contemplating these patterns allows individuals to synchronize their thoughts (mindset) and aspirations with this divine intelligence, establishing a connection that not only allows one to see the "handiwork of God" or the "Kingdom of Heaven within" physical creation but attune their lives to the overarching cosmic blueprint (one's Dharma or Life Path).

Structural Analysis continues in line with Sacred Geometry as the observing and contemplating of patterns (archetypes) inherent in nature and how they organize themselves within the financial markets. These patterns, again, containing the very essence of the divine principles governing existence, manifest themselves into various forms, including "price trend" structures according to divine intelligence within the pattern (Objective Reality).
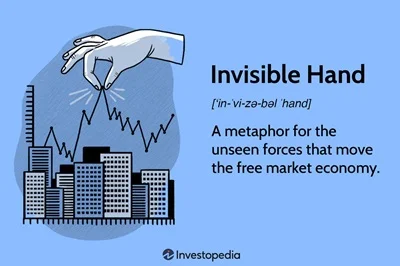
Beyond the surface appearance of binary code flashing across computer screens, financial markets, by nature, have a geometric structure. This structure is characterized by four essential dimensions: Time (1st dimension), Price (2nd dimension), Outcome (3rd dimension), and Collective Market Sentiment (4th dimension), often referred to as the Soul (house of Divine Intelligence or Spirit) or Adam Smith's Invisible Hand.
When arranged, these dimensions create a standard hypercube, a Tesseract, or a fourth-dimensional cube (we call the G.O.D. Code) —also prominently featured as the brand logo of Master Of The Trading Craft.
PRICE, TIME, OUTCOME, and SOUL are the sovereign dimensions of Market Objective Reality. Any attempt to ignore, usurp, or misrepresent the Tesseract arrangement creates market distortion/risk.
Unlike information ("research") and other tools investors and traders use to discern a stock market's true intent, these dimensions remain immune to corruption, moral interpretation, or misrepresentation. These 4 dimensions can only be OBSERVED and AGREED upon.
Technical and fundamental analysis are always applied to discern the 3rd dimension (Outcome) without awareness of and consideration for the 4th dimension, creating subjective bias. As a result, these tools rarely prompt traders and investors to make a case against taking a market position, thus creating mental blind spots that lead to ungrounded positions in the stock market.
Structural analysis, however, adopts a more holistic perspective.
In the financial markets, structural analysis parallels the construction and evaluation of a building for safe usage. Just as a building possesses both supportive elements and reinforcements to withstand potential stress, structural analysis gauges a potential position in the stock market by its structural integrity countered by any structural weakness.

Structural analysis delves into the interplay of all four dimensions, providing a comprehensive and objective view of market reality. While technical analysis fixates on price (and volume) alone, neglecting Time, Outcome, and Collective Market Sentiment, and fundamental analysis (in stocks) centers on "facts and figures" unrelated to the geometrical structure of the markets, structural analysis seeks harmony among these four dimensions.
The failure to observe the markets in their naturally harmonious form often leads to disrespect towards one's hard-earned capital in the form of financial losses, strategy-hopping born of frustration, and an overall unsatisfactory market experience.
The Master Key to Having Certainty of Consistently Profitable Outcomes
All financial markets (stock market) are 4th dimension structures and therefore, require you to see them as such to obtain favorable certainty in your investing endeavors. Seeing the stock market in its entirety requires something you never see mentioned in any trading book or investment course, nor promoted by the "experts," which is care.
Care is the master key to certainty.
In the discourse surrounding the 4th dimension, we've already covered that this is the realm of the Soul and the collective sentiment of market participants. Yet, there exists another aspect to this dimension, one symbolized by a "heart" in the hypercube illustration—a heart that aligns with the 4th chakra, the central point in Man's spiritual and inner economic system.
I care for the markets

as I care for myself.
Consider this: just as the Soul (market sentiment) drives Price over Time to yield a specific Outcome, your profound willingness to care, to immerse yourself in the intricacies of the markets, acts as the driving force that yields its own outcome.
When you embrace this perspective and dedicate yourself to understanding the markets with genuine care, you establish a connection with the markets at the soul level embarking on a transformative journey. In return for your care, the markets reveal their true nature, imparting their knowledge, wisdom, and understanding significant to you.
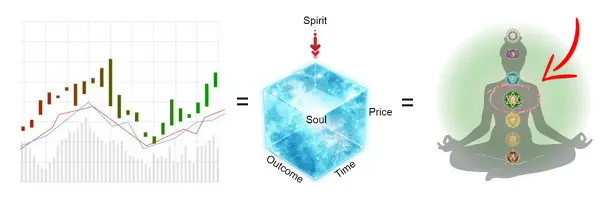
The G.O.D. Code
In reality, no financial market, not even the stock market, can transcend the boundaries of human nature. Just as all financial markets are structured as a hypercube or a "cube within a cube," this symbolic representation mirrors the intricate connection between an investor's inner world and the heartbeat (Soul) of the financial markets.
Therefore, to achieve congruence, one must discern (intuit) the flow of market sentiment at the soul/heart level and refine this flow into a structure (strategy) that is secured/confirmed by the other 3 dimensions until it perfectly reflects what is happening at the 4th dimension, or as the Scripture says, "As a man thinketh in his heart, so is he."
Regrettably, many stock market investors and traders tend to disregard or lack the empathy to discern the markets' true nature. Driven by intellect and ego, the realm of Man's 3rd Chakra, they remain primarily focused on what they can extract from these markets.
Whether it's the story of Sarah, who dreamed of "financial freedom" to secure her family's future, or Mark, who tirelessly pursued "wealth accumulation" to fund his globe-trotting adventures, their indifference towards the markets manifests as a deficiency in their market approach.
This apathy creates a stone or cold heart (inability to discern) at the 4th dimension resulting in market distortion at the third dimension, where only their desires, emotions (fear & greed), and intellectual assumptions hold sway.

To cultivate unwavering confidence in your stock market endeavors, it's imperative to perceive all markets through the lens of the fourth dimension – where we get harmony. Harmony is the order that gives all markets' structural integrity; without it, markets cease to exist as orderly [FOR YOU].
Harmony underscores that all price movement follows order and is devoid of randomness.
You will never witness a scenario where a "bullish trend will coincide with "bearish prices."
The soul's genuine intention to foster a bullish market will unfailingly guide price movements over time, aligning the 3 outer dimensions with the intent of the 4th dimension in an orderly manner. This unwavering reflection of harmony further underscores that outcomes invariably correspond to recurring patterns.
Recognizing and acting upon these patterns ensures a 100% certainty in achieving the desired results. Among these pivotal patterns is the foundation of our three-step stock option strategy – the Bullish Continuation Pattern.
Step 1 of Strategy: The Price Pattern That Wins Every Time
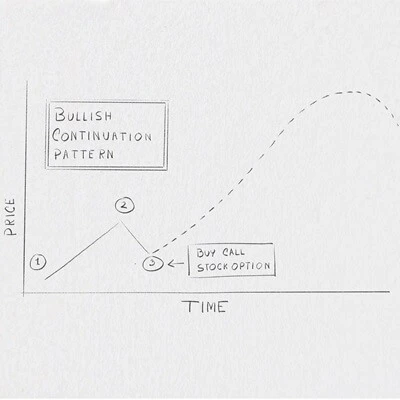
The Bullish Continuation Pattern is an awesome recurring pattern for forcing the stock market to dole out profits every time.
The Bullish Continuation Pattern always starts with a preexisting upward movement of the underlying stock price (1), the temporary exhaustion of upward movement sending stock prices temporarily downward (2), and the resuming of the upward price movement (3), often characterized by a greater force than its previous iteration at (1). The Bullish Continuation Pattern is perfect because it is basically "options-friendly."
This means:
Options have limited time to maturity, so the underlying asset must move up significantly and quickly enough for the call option to become profitable. A slow upward trend may not generate sufficient returns to cover the premium paid for the option, especially after accounting for time decay (theta).
The price of an option is influenced by implied volatility (IV). When IV is high, options become more expensive, and the buyer needs a larger price movement to justify the premium. Conversely, buying calls when IV is low can maximize returns, especially if IV rises during the trade.
Options-friendly trends often result from events or catalysts that trigger strong buying interest in the underlying asset. Examples include earnings announcements, product launches, or sector-wide momentum (e.g., AI stocks during a tech rally). Catalysts can ensure a steep price trend within the option’s time frame.
To take full advantage of its potential, we are going to use a simple long-call stock option play. This means we are buying a call option with the expectation that the underlying stock price will go up. This is a simple play for even beginners in options.
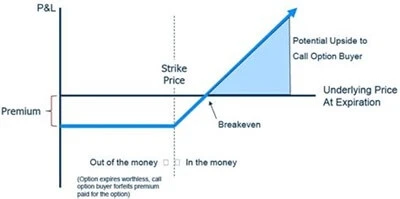
the long-call stock option play
What are options?
Harnessing the full potential of this strategy demands a solid understanding of what lies ahead. It's like embarking on a journey where knowing the terrain and having the right tools can make all the difference.
Options have earned their place as a preferred avenue for investment in the stock market. They offer flexibility, but like any powerful tool, they come with responsibilities, and the foremost one is understanding the risks involved.

Options are contracts that allow the buyer special privileges, such as the exclusive right to buy or sell an underlying stock at an agreed-upon price on a chosen future date. For those just starting, the emphasis should be on quality, not quantity, and prioritizing lower-risk investments.
Here's a real-world scenario: Imagine you're eyeing shares of McDonald's, currently trading at $100 each. Instead of going the traditional route, you opt for options trading. Now, with McDonald's stock priced at $100, if you believe that it's poised for significant future growth, options trading becomes an attractive prospect.
You decide to purchase call options, granting you the privilege to buy the stocks for $100 each. The beauty of options is that you can decide the number of shares you want to buy, let's say ten, all at the agreed-upon price within a defined timeframe, say a month.
Fast forward 25 days from the initial agreement. You notice that McDonald's stock has surged to $200 or even $300 per share. Yet, you still have the option (pun intended) to buy ten shares at the original price of $100 each.
In this ideal scenario, you stand to make substantial profits.
Now, let's explore the flip side. In a less favorable scenario where the stock price remains stagnant or, worse, plummets to $40 per share, your initial investment would translate into a substantial loss. However, stock options provide an escape hatch.
Instead of purchasing the stocks at the initially agreed-upon rate of $100 each, you can simply let the options contract expire and then buy the stocks at the current market price of $ 40 per share.
This is the essence of options —a versatile tool that grants you the flexibility to buy a stock at a predetermined rate. In a perfect world, it allows you to profit by purchasing at the initial price and selling at a higher future price.
Conversely, when things don't go as planned, you have the option to let the contract expire and buy the stocks at the prevailing market price.
To navigate the realm of options effectively, it's crucial to understand both its upsides and downsides. A balanced perspective is essential, providing you with a comprehensive view of this intricate financial landscape. In the following section, we'll delve into the advantages and disadvantages of options, ensuring you gain a well-rounded understanding of this complex world.
Advantages of buying (long) call options
These are the many advantages that make stock options one of the best paths to success in the markets. Now it is time to focus on the other side of the aisle, the disadvantages of stock options.
Disadvantages of options
Understanding call options basics will help you get the most value from applying this 3-step stock market strategy. While this knowledge reveals the advantages that can leverage your stock market performance, there are some potential downsides. But no worries. Countless articles have been written on options trading and its influence on the stock market, but they will not give you the real gems you are getting here in this lesson.
Why this call options strategy can not FAIL to produce profits.
Now that you have your basics covered on options, let's get back to the strategy...
In a nutshell, we will buy a stock option call at #3 on the Bullish Continuation Pattern.
Probability-minded stock market investors and traders will execute this strategy, and the results will either be a hit or miss, even though I mentioned that this strategy is FAIL PROOF. Why would they lose when I say that you can win with certainty?
I stand by my claim that this pattern is exact in what it will do. The problem is that a similar-looking pattern called a Bullish Trap Pattern will show up, and most stock market players can't tell the difference between the two until it's too late.
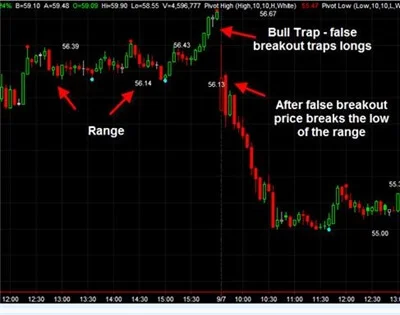
A bullish trap pattern is a false signal, referring to a declining trend in a stock that reverses after a convincing rally and breaks a prior support level. The move "traps" those that act on the buy signal and generate losses on assuming a long position.
This troubles investors and traders more than they like to admit. But I am here to tell you that it doesn't matter what they go through; you don't have to go through that. This strategy is well thought out and has been tried and trued to reflect the true nature of the stock market.
This is the strategy I use to help my clients secure profit on every stock option. Every precaution is in place to assure you that when you run this strategy in its entirety, you will have 100% certainty of success. Let's press forward.
So, how do we avoid this pitfall that beleaguers most stock market investors? In the second step of this strategy, I will reveal my secret formula to determine if the Bullish Continuation Pattern that confronts you is the "real deal" or a "false flag."
Step 2 of Strategy: Qualify Pattern's True Intent & Eliminating All Market Risk
Once we find a bullish continuation pattern, we must "qualify" it before we invest any money. The last thing you want to find out after you invest your precious capital is that the stock option was already "dead on arrival." Qualifying this pattern allows us to know ahead of time.
There are a couple of ways stock market players try to qualify a position. One way is to "hope and pray" it will turn out successfully. Some will use trendlines, technical indicators, or Fibonacci retracements to filter out the fake ones.
Others will not qualify the stake beforehand but will attempt to mitigate potential risk by placing a stop loss to protect some of their investment. Either way, this is inefficient.
I want to introduce a new, next-level way to qualify a market entry, particularly when stock options are purchased based on the Bullish Continuation Pattern. The first thing to do is measure the momentum in favor of the trend AND measure the momentum going against the trend.
In other words, qualifying means reading the pattern's momentum and its resistance.
We must measure momentum to see if the market has enough soul energy [4th dimnension] to move prices in the direction we expect the underlying stock to go. However, it's more important to measure the momentum going in the opposite direction of the trend.
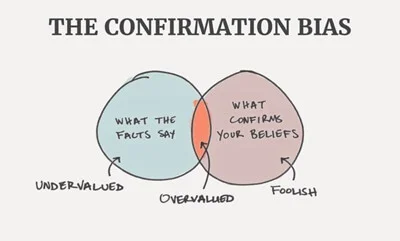
Most stock market participants have an inherent bias toward the direction they want the markets to go and rarely make a quantified case for NOT entering the stock market. Measuring resistance helps us avoid the possibility of being blindsided (confirmation bias) by unforeseen market forces at play. But the real reason why we want to measure resistance is because of something called the Popup Effect.
The Popup Effect
The concept of measuring resistance draws inspiration from the intriguing "Popup Effect." This experiment involves submerging a beachball underwater, and the depth of submersion provides valuable insights:


So, you may wonder, what does a beach ball have to do with the Bullish Continuation Pattern? This pattern is intricately linked to the laws of physics, offering us analogous insights into the Popup Effect:
Now, what sets apart a Bullish Continuation Pattern from a Bullish Trap Pattern? The key distinction lies in the amount of resistance exhibited during the downward price movement in relation to the momentum of the upward price trend.
The Qualifying Formula
The formula for making this determination is:
(Momentum/Resistance) – 100 = [absolute number]
(Absolute number must be less than 100. If quotient is negative, add to 100, then convert to absolute)
For the formula to work, you must first determine the amount of momentum for the trend (the difference between #1 [previous low] and #3 [today]) and the amount of resistance (the sum of #2 [recent high] and #3 [today]). Second, you divide the trend momentum number by the number for trend resistance, giving you a quotient.

Next, subtract the quotient from 100 to get the difference. Then, you convert the difference into an absolute number (no negative numbers). The difference is then converted into a percentage. This percentage serves two purposes:
Side note: This formula uses the Momentum technical indicator (settings 10,20) to measure Momentum and Resistance, which is ironic because I downplayed technical analysis as the "offspring" of the "probability mindset." In my defense, I'm using the Momentum indicator differently than conventionally used. Instead of using it as part of an enter/exit strategy, I am using it strictly to measure the amount of momentum.
Bullish Continuation Pattern or Bullish Trap Pattern?
My percentage threshold is 97% or better. Anything less than that and what appears to be a Bullish Continuation Pattern isn't. Therefore, the pattern is a no-go, and will pass on the stock as a potential candidate.
If equal to or greater than 97%, the market tells me this is a Bullish Continuation Pattern. At this point, I will consider the potential candidate further by using the percentage to determine a time value.
Time Values (Law of Diminishing Returns)
Each percentage from 97 and beyond (e.g., 98 and 99, to be exact) corresponds to future abstract points in time, where the energy thrust (soul) in an upward price trajectory begins to lose efficiency. In this illustration, I apply these percentages to the daily timeframe since I prefer to hold stock options for several weeks, sometimes even months.
These percentile correlations come from meticulously testing these percentages until you see 100% replicability in price trends.
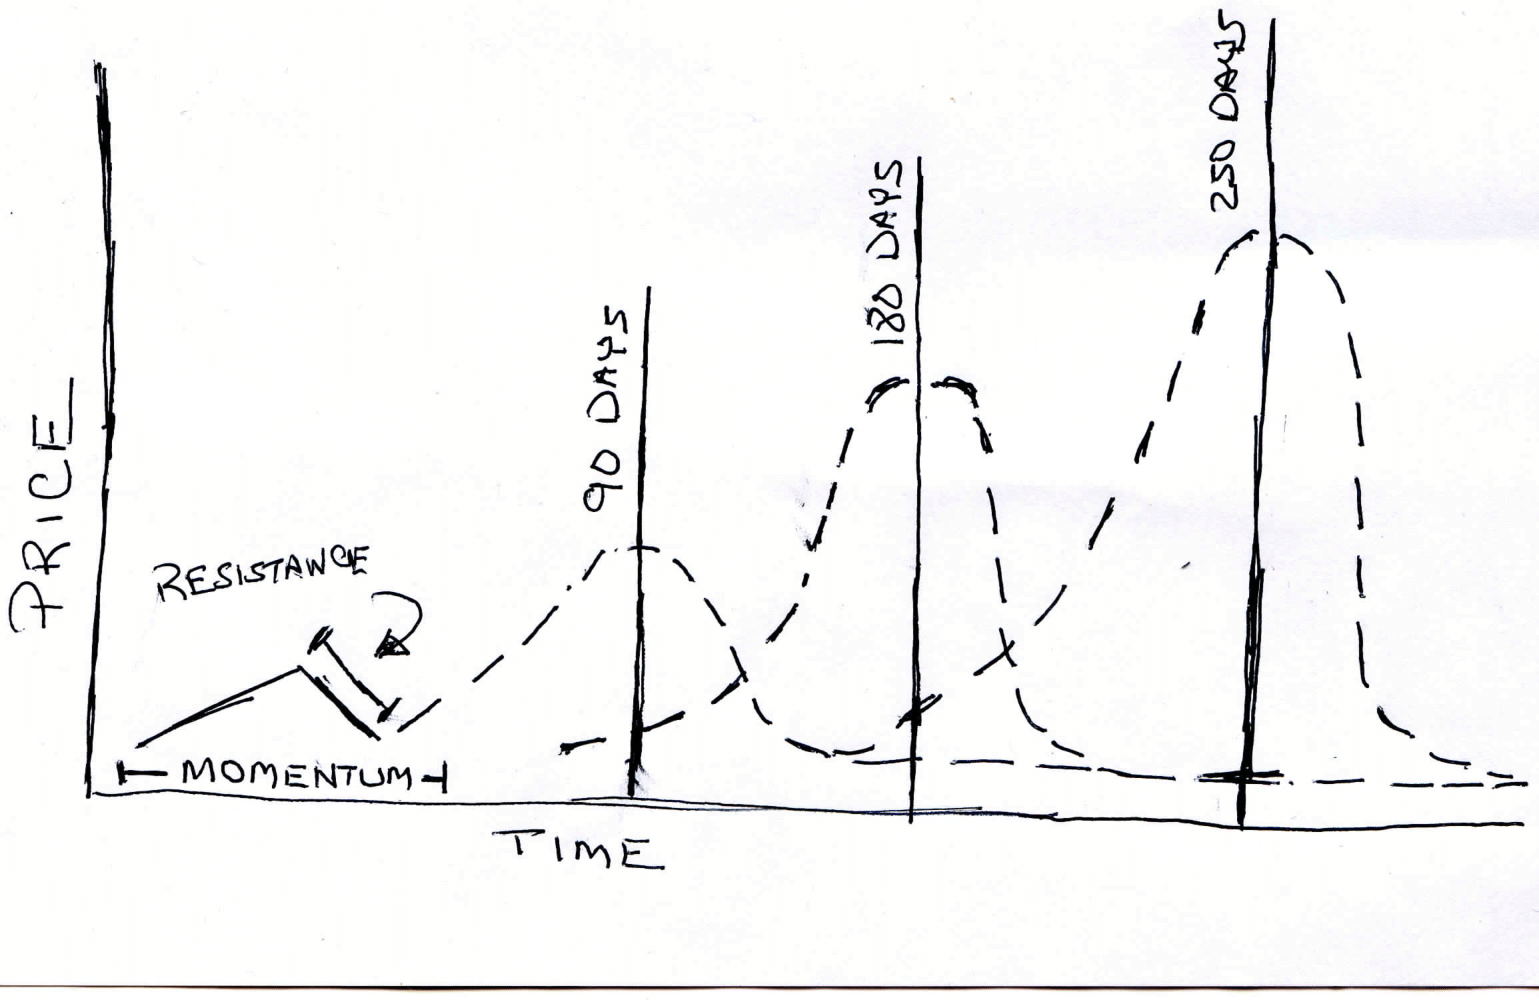
IMPORTANT: Many will dismiss the idea of finding "100% replicability" in the markets as absurd. As I said earlier, your care is the master key to certainty. If you care enough to look, you will find.
Having access to these time values holds significant importance as they directly relate to the duration in which prices are likely to maintain their trend or "stay in the air" before "running out of steam." For instance, if we identify a time value of 250 days, this signifies that after prices recover from a temporary dip, such as in a Bullish Continuation Pattern, they are expected to sustain an upward trajectory for a minimum of 250 trading days.
Understanding this time value allows us to strategically select an option with an expiration date that is closest to having at least 250 days remaining until expiration.
IMPORTANT: Time value percentages DO NOT imply that we can know the length of a trend from its beginning to its end. We DO NOT predict the future. Time value percentages, however, DO imply that a part of a trend of an unknowable quantity and of an unknowable duration, is indeed knowable, by way of measuring recent price momentum and resistance in the same way you can know at least some of the trajectory of an object slung by a slingshot by how far its pulled back and the amount of wind resistance.

Knowing time values is essential because the erosion of an option's time value is always a deep concern. Using time values will strike the "right mix" of holding the option long enough to maximize our gains without being greedy but not long enough to where the worth of holding the option becomes increasingly marginal.
Up to this point, we have a great advantage over other traders and investors because we now know the following before we've made any financial commitment:
So far, so good, but we have one more thing to figure out: when do we exit with a profit?
No worries. The 3rd and final step of this strategy will give us the answer.
Step 3 of Strategy: Calibrate Option Pricing Values To Determine Profit.
In this last step, I'm revealing the "secret sauce" to safely get the most profit from your stock option investment. Ready? Let's begin.
First, when I speak of profiting on a call stock option, technically, I am talking about the expectation that the option premium or the total price paid to buy the option will increase sometime in the future.
With that, the key to understanding option profitability is to understand option premiums.
Factors that impact an option's premium are:
It is complex to compute the option premium by hand. For that, you would need to look at an option pricing model. Fortunately, financial websites like this will do all the work for you. However, in simple terms, the premium is seen as an asset's intrinsic value added to the time value.
We now have an idea of what option premium is and the ingredients that comprise it. Next, we want to focus on implied volatility, the key component to getting the most profits from our options.
Implied Volatility
Implied volatility is an essential ingredient in option premiums. Stock options with less volatility have lower premiums than those with higher volatility. Make sense?
Moreover, Implied volatility is the markets' estimated expectation of the future value of an option. An option's implied volatility is a quantifiable way to gauge how the market feels about the options (market sentiment at the 4th dimension).
When we use implied volatility as part of our profit-taking plan, we gain an advantage over others who use arbitrary profit-taking means like:
By using implied volatility in a certain way, we are, essentially, allowing the markets to reveal what they think is a probable future value of the option. We then use this to our advantage as to when to best take profits.
This is the first component in our profit-taking plan. The next step is to understand something called historical volatility.
Historical Volatility
Implied volatility focuses on predicting the option's future behavior, while historical volatility assesses the recent price history of the underlying stock. Historical volatility measures the underlying stock's price fluctuations over a predefined period, often in terms of standard deviations or the extent to which the price dataset deviates from typical fluctuations.
In simpler terms, it quantifies the rate at which prices rise and fall over time. When you chart these fluctuations, they form a bell-shaped normal distribution curve.
Historical volatility suggests that past prices tend to experience fluctuations, including occasional abnormal ones, but ultimately gravitate back to the norm. Expanding on this, these extreme fluctuations often manifest as market trends that persist for a while before seeking equilibrium and returning to normalcy (back to the mean).
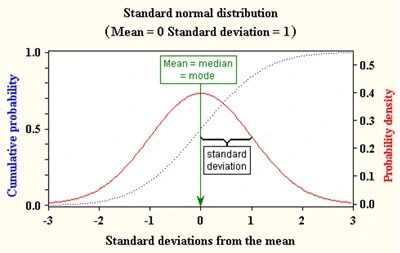
This phenomenon corresponds to the "Popup Effect," where prices breaking out to the upside undergo extreme deviations from the norm but eventually revert when momentum wanes and prices decline.
From this distribution of prices, we get important information. First, the prices with extreme fluctuation rates (measured in deviations from the norm) fall to the right and left of the "bell."
The prices with less fluctuation are displaced in the middle of the "bell."
In the distribution curve, the most frequently occurring price is the mode price. It always exists in the middle of the bell and is the key component in our profit-taking endeavors.
We will touch on this later.
Market Inefficiency and Efficiency: Getting the full picture
In theory, stock prices are expected to conform to a normal distribution because markets are efficient is the assumption. However, in reality, prices don't always neatly align with this norm. They can exhibit consolidation into normal distributions, but there are also instances of inefficient movement, which we refer to as price trends.
If we solely adhere to the assumption that markets are efficient, we can be blindsided by the potential impact of potentially adverse price trends on our portfolio. Conversely, if we perceive the stock market as purely chaotic and riddled with extreme deviations, we lack the grounded context needed for making informed choices.

The best path lies in striking a balanced understanding between market efficiency and market inefficiency by using both historical volatility and implied volatility in our stock options strategy.
How can we achieve this? It's simple: divide the historical volatility (linked to the underlying stock of the call option you intend to buy) by implied volatility (associated with the call option you're purchasing). This approach allows us to harness the benefits and efficiencies of both worlds.
Once you divide historical volatility by implied volatility, you get a quotient. This quotient tells us how far to skew the normal distribution for implied volatility to reflect the combined viewpoints – providing a more realistic range of values.
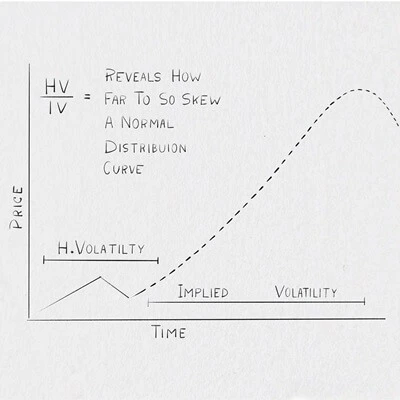
This calculation confirms that we expect stock market prices to make a big move shortly (implied volatility), but not too big that it's out of the scope of past price movement (historical volatility).
For example, If the quotient is .7 or 70%, the computation tells us how far to skew (in deviations) the normal distribution of the implied volatility curve to the left or right – depending on which direction you expect a stock to go. A normal distribution is always at 0 deviations or 50% (half of the prices fall on the right [down] and the other half fall to the left[up]).
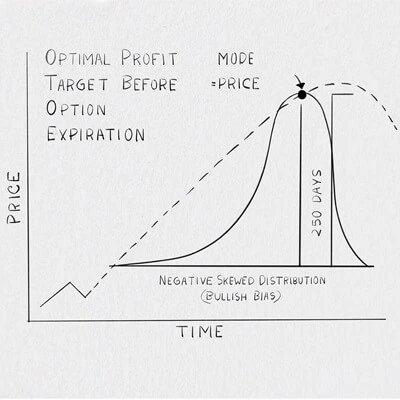
Since this lesson centers around the Bullish Continuation Pattern, we will adjust the normal distribution of prices negatively by 70% or 2 deviations (70% - 50% = 20% or 2 deviations).
This newly adjusted distribution will give us a new mode price. This number is our optimized profit target.
It represents the best price we can get for our option while maintaining efficiency in the stock market. This mode price is also the most frequently occurring price the market will trade, which guarantees that we can sell the option at this price. Awesome, right?
Ready To Turn Stock Options Into Your Pot Of Gold?
Thank you for checking out my step-by-step fail-proof stock option strategy. To recap:

These instructions form a solid plan that will tell you everything you need to know before you enter the stock market:
With just a bit of dedication and investment in time, you can have this strategy working for you, generating outstanding and foolproof positive market outcomes at every turn.
🎈🎂Cheers to your future success!
Ready to apply this strategy without the trial and error?
If you’d rather skip the guesswork — and have every move executed with precision — we’ve built a premium alert service designed to do exactly that.
This isn’t another generic stock tips platform.
It’s a done-for-you solution that applies the exact 3-step strategy you’ve just learned — with timing, accuracy, and discipline baked in.
And because we stand behind every alert we publish, this is the only service of its kind that offers a 100% refund guarantee if any target isn’t hit.
Before we extend an invitation, take 2 minutes to complete a short client fit assessment.
It ensures this service is right for you — and that you’re right for it.
Copyright © 2025. King Ra Child Media. All rights reserved
About | Trading Disclaimer | Privacy | Terms Of Service | Terms Of Purchase | Refund Policy
